Explore how Curtis Holt’s Blender MRI Visualizer tool transforms complex medical scan data into interactive 3D models. Learn about its collaborative development, functionality, and how to visualize your own MRI data with powerful Geometry Nodes techniques.
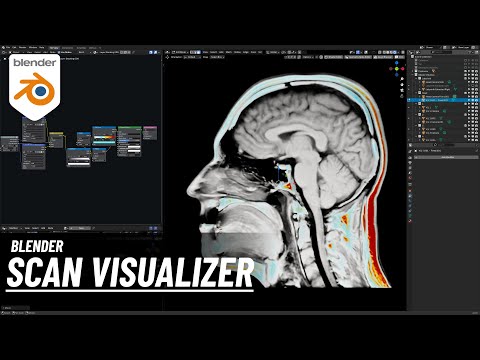
Ever wondered how to turn intricate medical scan data into captivating 3D visualizations? Renowned Blender artist and educator, Curtis Holt, has developed an incredible MRI visualization tool that does just that. This professional yet user-friendly solution, created in collaboration with Ben (Carteesian Caramel), allows users to explore MRI data in unprecedented detail, moving beyond static images to dynamic, interactive models within Blender.
Holt’s motivation for this project was deeply personal, stemming from his own vestibular issues and the desire to visualize his MRI data. This led to a joint venture with Ben, who was initially interested in CT scan visualization. Their combined efforts in 2023 resulted in a powerful method for converting MRI “flip book” image slices into a comprehensive 3D volume.
Understanding the Core Mechanics
The foundation of this visualization tool lies in its ability to process MRI scan data, which typically comes as a series of grayscale image slices. These slices are compiled into a “flip book” file, much like a sprite atlas. From this flip book, the tool constructs a full 3D volume using either Blender’s shader or Geometry Nodes. Because MRI data primarily captures soft tissue (unlike CT scans which focus on bone), the grayscale information can be passed through a color ramp to create various visual styles, including a heat map effect, making complex structures instantly more interpretable.
A fascinating aspect of MRI technology, as mentioned by the creator, is its capacity to reveal intricate details. For instance, specific MRI subcategories like AM scans can even map out structures as delicate as the inner ear. This capability makes such visualization tools invaluable for medical study and personal understanding.
A Collaborative Journey and Project Forks
After their initial collaboration, the project evolved into two distinct, yet complementary, resources. Ben, known as Carteesian Caramel, released his version as a free resource on Gumroad, making it accessible to a wider audience. Notably, this version includes some of Holt’s personal medical data, specifically his inner ear/cochlea, with his explicit permission for educational use.
Holt, on the other hand, developed a “master visualization file” for his own continued analysis of his 2023 data. This comprehensive file incorporates a broader array of visualization styles and methods. This master file, also containing his medical data for educational purposes, is now available to his silver-tier patrons and above, offering advanced users deeper control and functionality.
Converting Your Own Scan Data with the Packer Tool
One of the most powerful features in Holt’s Patreon resource is the “image flip book packer tool.” This ingenious utility allows users to convert their own MRI scan images into the specific flip book format required by the visualizer. The process involves a few key steps:
- Obtain Scan Slices: First, you’ll need your MRI scan slices in an image format. Hospital-provided DICOM files will need to be converted using a separate third-party tool (which is not part of this Blender offering).
- Import into Blender: Import these individual image planes into a dedicated collection within Blender.
- Apply Packer Modifier: Apply the “object image packer” modifier, selecting your image collection and specifying the number of rows and columns (e.g., 5×5) to achieve a 1×1 aspect ratio for the resulting flip book. You can also set the rendering resolution.
- Render and Import: Once rendered and saved, this new flip book image can be imported directly into the scan visualizer file. You’ll replace the default nodes in the shader with your custom flip book.
- Adjust Slice Value: Crucially, remember to adjust the “slice” value in the visualizer to match the rows/columns setting used during the flip book creation (e.g., x5 for a 5×5 grid) to ensure accurate visualization.
Fine-Tuning Your Visualizations
The visualizer offers extensive control for both artistic expression and analytical precision. A 3D representation in the bottom left corner allows for dynamic manipulation of viewplanes. Users can prevent “volume bleed” by keeping faces tightly aligned or create a more expansive 3D representation by moving a single face back. Within the shader nodes, a “divide value” located before the color ramp provides granular control over the range of the heatmapping, enabling customization to highlight specific data ranges or achieve desired aesthetic effects.
The application of Blender, a powerful open-source 3D creation suite, in scientific and medical fields is a growing trend. Its versatility, combined with features like Cycles and Eevee rendering engines, makes it an ideal platform for researchers and medical professionals to visualize complex data in engaging and informative ways. Curtis Holt’s tool is a fantastic example of this innovative intersection.


